March 2025 Market Update

Going into April is always an interesting time with the change of seasons, especially as we now look into the winter market and what it may hold. We are definitely back to the ebb and flow within the market. As winter approaches, movers’ motivation drops away as they prefer to stay put for the colder, darker months.
Owners Are Back in Control
Owners now have the ability to decide what occurs at the end of a fixed term tenancy. Under previous government changes, the tenants called the shots so to speak. The tenant had the final say whether the tenancy reverted to periodic at the end of the fixed term or if they wished to stay on for another fixed term. Well things have changed there, the landlord now calls the shots and now it is easier to have fixed term tenancies end on their expiry date if you so wish. We will still need to take action if you want the tenancy to end.
When a landlord or tenant gives notice to end a fixed-term tenancy between 90 and 21 days before the fixed term ends - no specific reason is required; or both tenant and landlord agree on an alternative which is where another fixed term period comes in.
Traditionally, we haven’t ended tenancies in the winter period as the market is less enthusiastic at that time, similarly late December into early January when most people are on holidays. With this change, we are now able to prevent the fixed term becoming periodic and secure another fixed term. The fixed terms are favoured, it gives the tenants some security to tenure and the landlord some security of occupancy and control as to when the property may come to market.
This change also gives us the ability to move the prospective date of when the property may become available to re let. Moving it out of the June, July, August period and into the autumn and spring seasons where people are more inclined to move. It’s all about minimalizing vacancy and maximising returns.
The administration of re-establishing those fixed terms will take some working through and there could be a small administration fee to complete that for you.
Is the Rental Market in Favour of Tenants?
Net migration has changed strongly since the record net gain of 135,000 people in the year to October 2023. The annual gain now is 32,000 and looks like it’s plateauing. New Zealand has one of the most churning populations in the world. Each year on average we lose about 1.8% of our population and gain about 2.5%. If one of these flows moves up at the same time as the other moves down, then the difference between them in terms of the number of people can shift quite violently.

Secondly, there is an over-supply of townhouses in Auckland and Christchurch and some developers have put a part of their unsold stock into the rental pool.
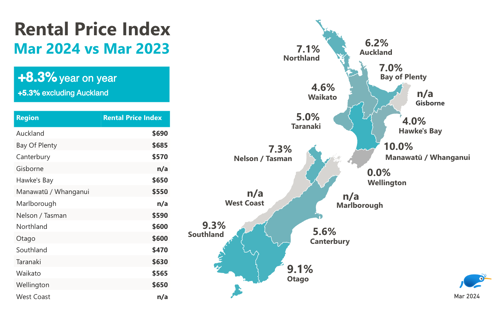
Having just done the rent reviews for June, it would be fair to say that the overall picture is modest. Some sectors of the markets are at the same rate as what they have been for the last year. We see this from time to time in the market where there is an equilibrium with supply and demand in that part of the market. We must be right on point, as the recent Rental Price Index shows a 0.0% average change year on year Feb 2024 to Feb 2025.
While for some that is not the best news they have had this month, let’s take a look where we’ve come from since COVID lockdowns.
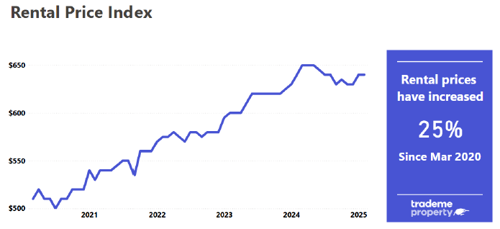
New data reveals a substantial 25% increase in the national median weekly rent since the March 2020 lockdown, jumping from $510 to $640 per week, according to Trade Me’s latest Rental Price Index.
The pandemic disrupted the housing market significantly from the minute the first lock down was announced. The “stay home, stay safe” mandate, led to increased demand, on what was already a very tight market. Couple that with rising inflation and job losses, the pressure led to some big swings in rental prices in the months and years that followed.
So, while things may have flattened for the time being the overall picture has been very positive over the last five years.
Interestingly, Wellington remains the most expensive main centre for renters in New Zealand according to Trade Me’s February rental data. The median weekly rent in the Wellington and Auckland regions decreased by 1.5% month-on-month. Despite this, Wellington holds the top spot at $665, just ahead of Auckland at $660. This comes at a time when Wellington is also facing economic headwinds in the commercial space.
Rental Swings for Larger Properties
This month's rental market data revealed a drop in median weekly rents for larger homes.
While urban dwellings experienced more subtle adjustments, houses with five or more bedrooms saw dramatic changes across major cities. Auckland witnessed a 6.1% decrease, bringing the median weekly rent to $1,080. Wellington also experienced a substantial drop of 8.7%, settling at $1,100.
In stark contrast, Christchurch saw a remarkable 15.6% uplift, pushing the median weekly rent to $1,040 – nearly a $100 increase from January's $950. My experience is that this has been driven by the extreme pressure within the Christchurch student accommodation space.
In contrast, the urban rental landscape showed more moderate fluctuations. Townhouses in Auckland and Wellington both saw declines, with Auckland dropping 3.5% to $695 and Wellington falling 4.8% to $700.
In Christchurch, apartment median rental prices dipped slightly by 2.9% to $505, while units saw a modest increase of 4.4%, reaching $470.
Yes, rents pay the bills but we all live in hope of some capital appreciation, a.k.a. capital gain, the long term buy and hold investor will say this is where the money is. Many have tried to control this function of the free market but it makes its own rules. Canterbury, on average has had an annual rise in price of 5.7% per annum, year-on-year from 1992-2024.

REINZ released their monthly data last week. At an NZ-wide level, prices are looking like they are trending higher when we look through the month-to-month volatility. That is, while the REINZ index rose by a large 1.4% in February this followed falls of 0.1% in January and 0.8% in December. The average monthly change in the three months ending in February was 0.2%, compared with 0.7%, in the three months to November and -0.3% in the three months to August.
Meth - To Test or Not To Test?
You may know that the Institute of Environmental Science and Research (ESR) conduct a Wastewater Testing Programme in conjunction with the National Drug Intelligence Bureau. Their Q4 2024 report has just been released and shows Methamphetamine use across sample sites remained elevated in Q4 2024, averaging an estimated 36 kilograms per week.

So, it would be fair to say that as a cross section of the community there is a prevalence of Meth around.

Canterbury shows the second lowest level across the tested sites but alarmingly now twice the level it once was.
So what you may say, well a landlord is responsible for a raft of requirements under the RTA. Section 45 of the Act has an insomnia curing list of them but essentially the landlord shall—
- provide the premises in a reasonable state of cleanliness
- comply with all requirements in respect of contaminants imposed on the landlord by regulations made under section 138C(3)(c);
- comply with all requirements in respect of buildings, health, and safety under any enactment so far as they apply to the premises;
So, if a landlord has tested their tenanted rental property and established that the premises are contaminated, if they don’t get it decontaminated in accordance with the relevant prescribed decontamination process, then this is an unlawful act. Unless it can be established that the tenant was the cause of the contamination. The tenant would be issued a seven day notice to vacate.
Or, if the premises are vacant, the landlord must not tenant the property until the premises have been decontaminated.
Section 138 pretty much sets out that the Government can prescribe maximum levels and prescribe methods for testing amongst other things.
Sounds dire? Do you need to test? Section 45a gives some protection to the landlord, it says;
- 45a applies to a landlord of premises during any period where—(a) a contaminant is present at the premises, but either—
- the premises are not contaminated with the contaminant or unknown to the landlord, the premises are contaminated with the contaminant and regulations made under section 138C(3)(c) are in force in respect of the contaminant and apply in relation to the premises.
In other words, if the landlord was unaware meth was present, having complied with those regulations during that period, they are not liable, under the Act, for not having provided the tenant with clean or habitable premises. However, this is not a complete “get out of jail” free card, as it gets quite technical.
The thing with meth testing is when, not if, is a good time to test. At some point in time there is going to be a need to have a test done. For some, that will be triggered by a sale or the thoughts of selling. It is best to know if your rental is contaminated before a purchaser does and a sale falls through. For others, it will be between tenancies, so you know the property is meth free or worse case scenario when and who contaminated it.
We call the initial test a baseline and recommend it for any new build or a newly purchased property. I personally recommend between tenancy testing, as it makes the ingoing tenants aware testing is conducted, should they feel inclined to use meth in the property and holds those to account, who happen to use meth in the property.
Is Now Is A Good Time To Invest In Property?
At every end of financial year, I like to ask that question, my answer being - of course it is! Saying that, it’s hard to pick exactly where we are within the property cycle. Some of the indicative factors would show we’ve moved from what was a 4-5 o’clock, back in time to more around a 3. We do have high unemployment and an oversupply of tradespeople readily available. The number of properties listed for sale are higher than we’ve seen but prices are holding. For me, I see value in building at the moment as rates are very competitive or buying new as there is good value in those currently.

The Local Market Stats
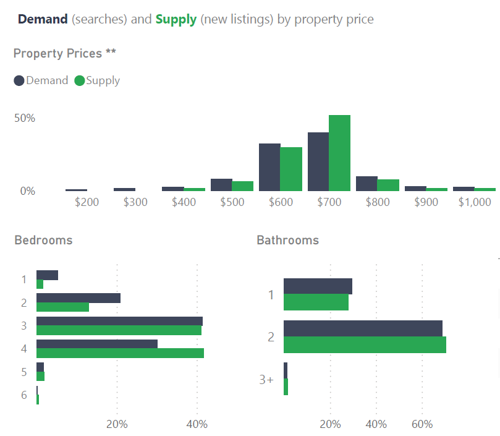
Available properties for rent are back up to 1128 in the Christchurch City area as shown on Trademe. This explains rents being pretty flat as it wasn’t that long ago when we were down in the 600’s. Selwyn has 90 available and Waimakariri 133. The supply and demand curves haven’t moved much for Christchurch of late with two bedrooms still feeling oversubscribed.
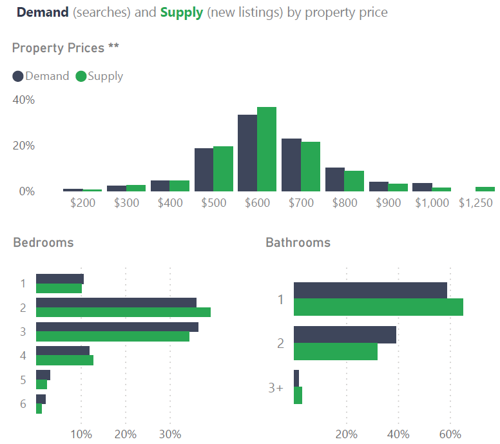
Selwyn shows a different picture with the four bedroom space being oversubscribed, three bedrooms are about right and there is a shortage of two bedroom properties.
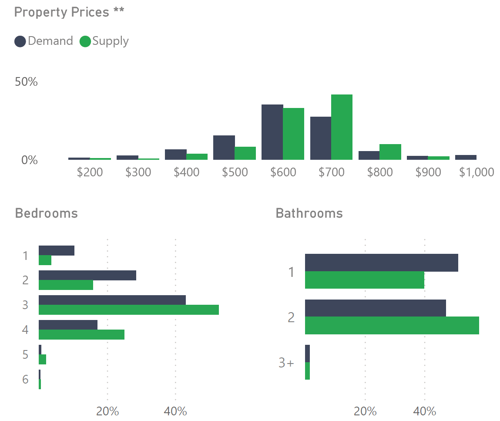
Out to Waimakariri and it’s not too dissimilar to Selwyn in the two-bedroom space but it would appear that supply is keeping up with the other property types.
Anyway, you’ve probably had enough of my commentary for now, as always, the team and I are always just a phone call away. We are always available for a free chat and are happy to share our experience and knowledge wherever we can be helpful.
Hamish and the Team @A1